

AI reporting & insights for your business phones.
Do you know your busiest time of day? How many calls you get a week, or a month? Whether every call is being answered? Cloud Connect turns your call data into clear answers and AI-powered insights.
Answers about your calls, not just call logs.
Every call already leaves a record. AI reporting turns those records into the answers owners and office managers actually need.
What's our busiest time of day?
See call volume by hour and day of the week, so you can staff the phones when customers actually call.
How many calls do we get a week, or a month?
Track call volume week over week and month over month, and spot seasonal swings before they catch you short.
Are all of our calls being answered?
See answered, voicemail and missed calls at a glance, and when the missed ones happen.
Who is handling the calls?
Call history by extension, user and queue shows how the work is shared across your team.
Can we get this without logging in?
Scheduled email reports arrive in your inbox automatically, or view reports on demand in the portal.
What should we do about it?
AI insights turn the numbers into plain-language takeaways and suggested next steps.
What your reports look like.
Example reports with sample data. Hover over or tab to any cell or bar for the details, or open the table view.
Busiest hour: Tuesday, 10–11 a.m.
View as table
| Day | 8a | 9a | 10a | 11a | 12p | 1p | 2p | 3p | 4p | 5p |
|---|---|---|---|---|---|---|---|---|---|---|
| Mon | 6 | 14 | 21 | 18 | 9 | 11 | 16 | 13 | 9 | 4 |
| Tue | 7 | 16 | 24 | 20 | 10 | 12 | 17 | 15 | 10 | 5 |
| Wed | 6 | 13 | 19 | 17 | 8 | 10 | 15 | 12 | 8 | 4 |
| Thu | 5 | 12 | 18 | 16 | 8 | 10 | 14 | 12 | 8 | 4 |
| Fri | 5 | 11 | 15 | 13 | 7 | 8 | 11 | 9 | 6 | 3 |
| Sat | 2 | 4 | 6 | 5 | 3 | 0 | 0 | 0 | 0 | 0 |
- ✓Answered1,193 · 92.9%
- ✉Voicemail64 · 5.0%
- ✕Missed27 · 2.1%
View as table
| Outcome | Calls | Share |
|---|---|---|
| Answered | 1,193 | 92.9% |
| Voicemail | 64 | 5.0% |
| Missed | 27 | 2.1% |
Average 449 calls a week over the last 12 weeks
View as table
| Week of | Calls |
|---|---|
| Jul 7 | 412 |
| Jul 14 | 438 |
| Jul 21 | 401 |
| Jul 28 | 455 |
| Aug 4 | 389 |
| Aug 11 | 467 |
| Aug 18 | 482 |
| Aug 25 | 446 |
| Sep 1 | 371 |
| Sep 8 | 503 |
| Sep 15 | 521 |
| Sep 22 | 498 |
2,087 calls last month, up 9% on the month before
View as table
| Month | Calls |
|---|---|
| Oct | 1,688 |
| Nov | 1,742 |
| Dec | 1,391 |
| Jan | 1,655 |
| Feb | 1,718 |
| Mar | 1,874 |
| Apr | 1,806 |
| May | 1,903 |
| Jun | 1,777 |
| Jul | 1,812 |
| Aug | 1,919 |
| Sep | 2,087 |
- Tuesday 10–11 a.m. is your busiest hour. Consider scheduling an extra person on the phones, or let Voice AI handle overflow.
- Most missed calls come in over lunch (noon–1 p.m.). A hunt group or Agentic Voice AI would catch them.
- Call volume is up 9% month over month, led by Monday and Tuesday mornings.
- Saturday calls stop at 1 p.m. Check your Google Business Profile hours match.
Your whole phone system on one screen.
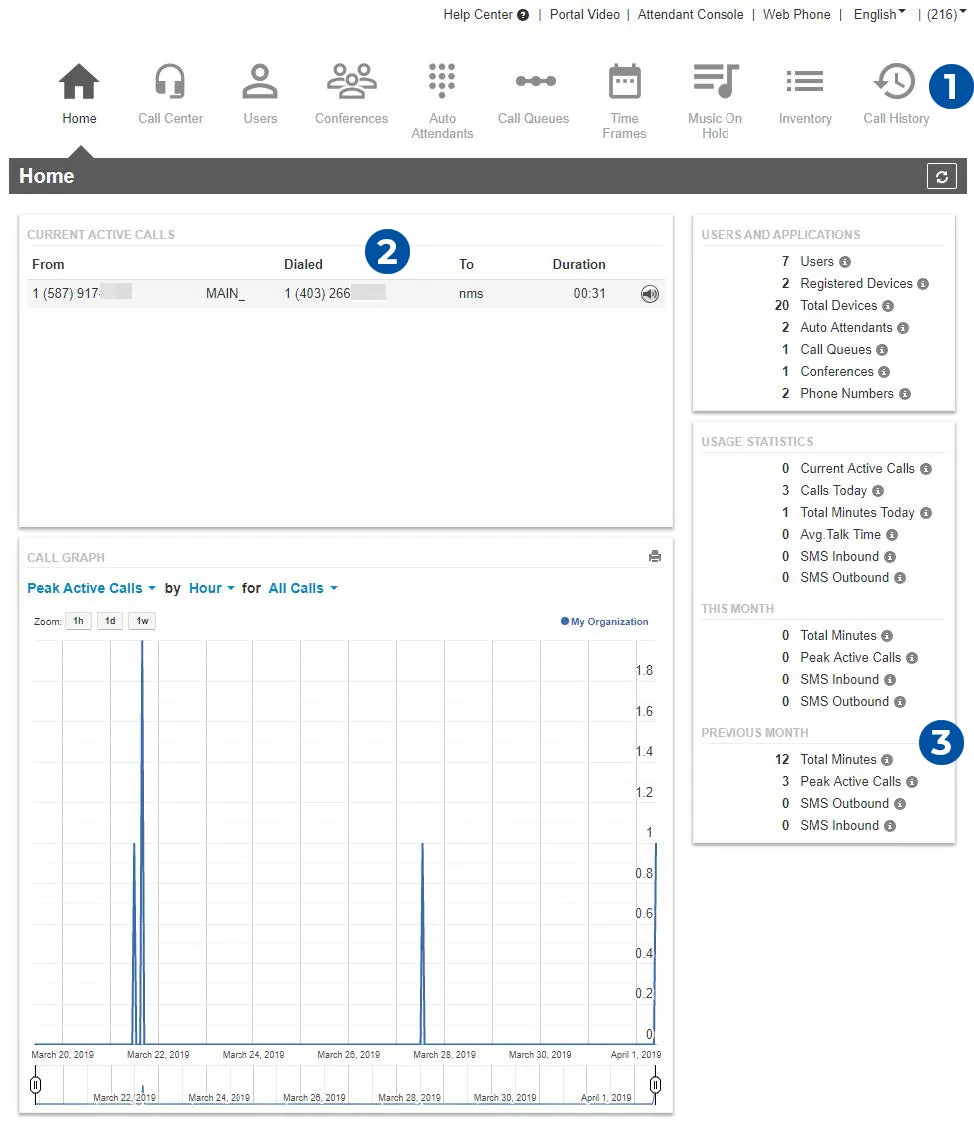
This is the kind of usage reporting you get with Cloud Connect: call volume, answer rates, busy hours, queue activity and health checks that flag problems before your callers notice them. The figures are sample data for an example business.
View as table
| Queue | Calls | Abandoned |
|---|---|---|
| Sales | 412 | 3% |
| Service | 356 | 5% |
| Front desk | 298 | 2% |
| After hours | 14 | 100% |
- Incoming
- Outgoing
View as table
| Week of | Incoming | Outgoing |
|---|---|---|
| Aug 4 | 241 | 148 |
| Aug 11 | 290 | 177 |
| Aug 18 | 299 | 183 |
| Aug 25 | 277 | 169 |
| Sep 1 | 230 | 141 |
| Sep 8 | 312 | 191 |
| Sep 15 | 323 | 198 |
| Sep 22 | 309 | 189 |
Peak: 10–11 a.m. · lunch dip at noon
View as table
| Hour | Calls |
|---|---|
| 07:00 | 26 |
| 08:00 | 118 |
| 09:00 | 262 |
| 10:00 | 371 |
| 11:00 | 318 |
| 12:00 | 164 |
| 13:00 | 197 |
| 14:00 | 268 |
| 15:00 | 221 |
| 16:00 | 142 |
| 17:00 | 58 |
- ✕CriticalQueue "After hours" took 14 calls with no agents signed in
Every one of those callers was abandoned. Add agents to the queue or send it to Voice AI.
- !High1 extension has no 911 address
Emergency responders would not know where to send help for that phone.
- iLow2 extensions have been idle for 90 days
Former staff or spare lines you may still be paying for.
Insights you can act on.
Reports tell you what happened. AI insights point out what matters: when calls peak, when they're missed, and how volume is trending. They also suggest what to change, such as adding someone to a hunt group over lunch or letting Agentic Voice AI catch overflow calls.
- Detailed call history: time, day, duration and originating number for every call
- Downloadable call logs by extension or for the whole company
- Scheduled email reports, or on-the-fly views in the portal
- Billable-time tracking for every second spent on the phone with clients
Real-time dashboards for your queues.
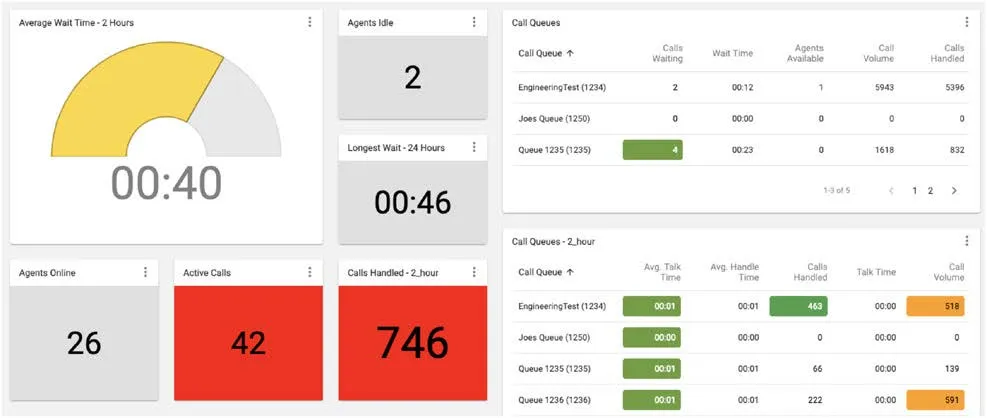
Running a call queue? The cloud contact centre adds a real-time analytics dashboard and a customizable wallboard: callers waiting, average wait and handle time, abandon rate and agents online, included at no extra cost.
Local call reporting and VoIP across Alberta.
Cloud Connect works anywhere in Canada with a good internet connection, and our team is close by for setup and support.
Calgary
Airdrie, Chestermere, Cochrane and area.
Calgary phone systemsDrumheller
Rosedale, East Coulee, Carbon and area.
Drumheller phone systemsMedicine Hat
Redcliff, Dunmore, Desert Blume and area.
Medicine Hat phone systemsAnywhere in Canada
Canadian data centres, Canadian numbers and Canadian support.
CoverageFrequently asked questions.
What can Cloud Connect's AI reporting show me?
Your busiest times of day and days of the week, how many calls you get each week or month, and how many calls were answered, went to voicemail or were missed. Call history is also broken down by extension, user and queue, with AI insights that summarize trends in plain language.
Can I see if calls are being missed?
Yes. Reporting shows answered, voicemail and missed calls, and when they happen, so you can see whether every caller is getting through.
Can reports be emailed automatically?
Yes. Reports can be scheduled to arrive by email, and you can also view them on the fly in the Cloud Connect portal.
Does reporting work with the contact centre?
Yes. Contact centre customers also get a real-time analytics dashboard and wallboard with queue metrics such as wait time, handle time and abandon rate.
Is call data kept in Canada?
Yes. All live call data is stored and processed on Canadian infrastructure, across data centres in Vancouver, Calgary, Ottawa and Montreal.

Is your network ready for Cloud Connect?
Run our free line test in your browser — it checks your connection for call quality in about a minute.
See your own call data come to life.
Ask us for a walkthrough of AI reporting using your business's call patterns, or call us directly.